
How to use FreeSurfer – Part 2
Introduction
In this chapter, we are going to take a deep dive into FreeSurfer’s output and make some clarifications about it.
After data processing from in Part 1, you should see something like this:
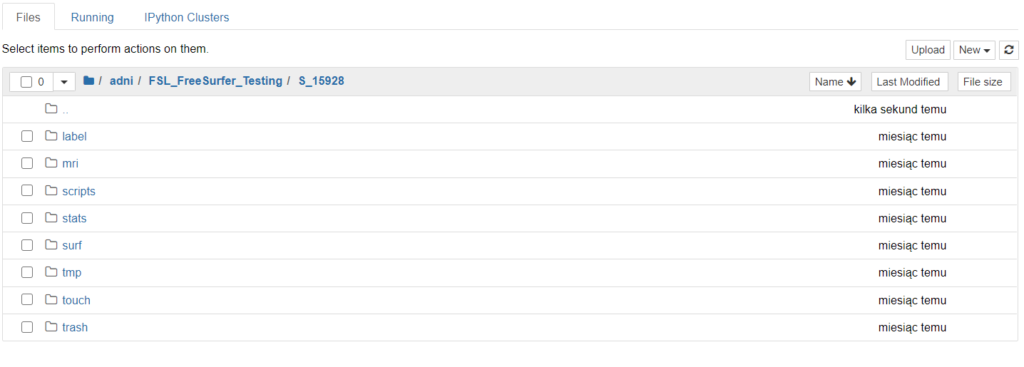
We will mainly focus on folder “stats” because it contains files with plain text. Which is good for some visualizations and analyses. I will go through the most useful tools and commands.
aseg.stats
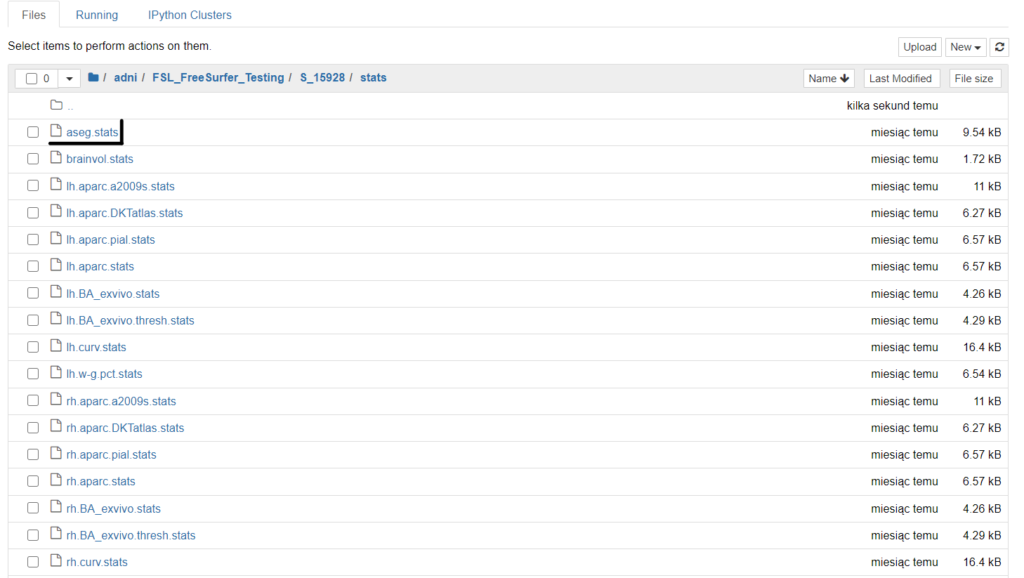
I know, there is a lot of files but we gonna go through that.
“aseg.stats” output file contains data for subcortical brain structures. This file should be your first choice if you are going to make some simple analyses. Why? Because it has everything in plain text and it is easy to convert, even to an Excel file. Generally speaking, from files with “.stats” extension you can obtain information such as the volume of the left hippocampus, its mean intensity, etc.
We will be more interested in the the bottom section of the file.
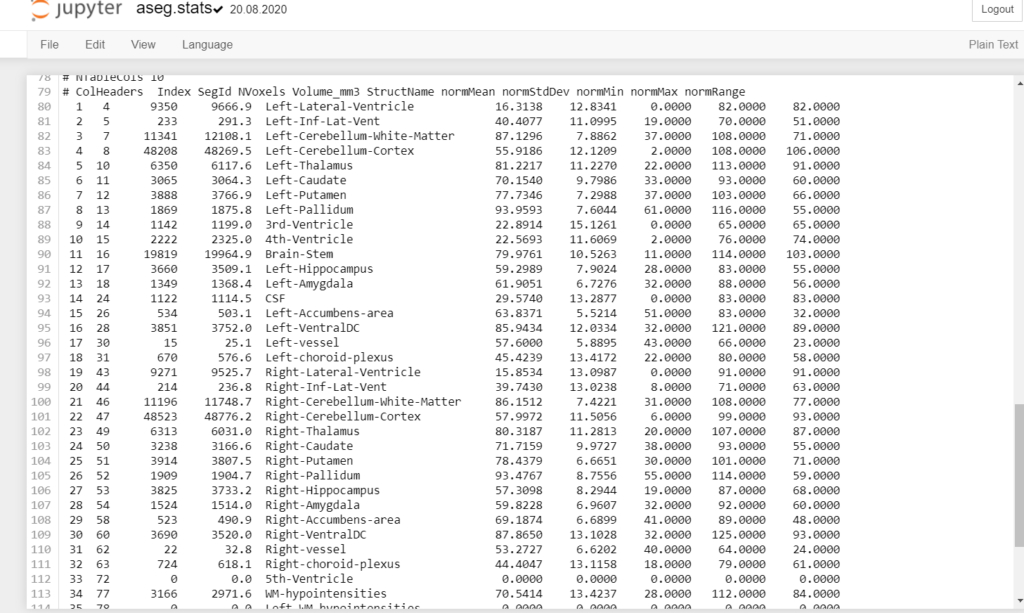
As you probably noticed by now, the content of the is a little bit fuzzy. First, we are going to make it look just better and way more useful.
asegstats2table
This little script will help reorganize file aseg.stats and put it into a spreadsheet. Let’s write it!

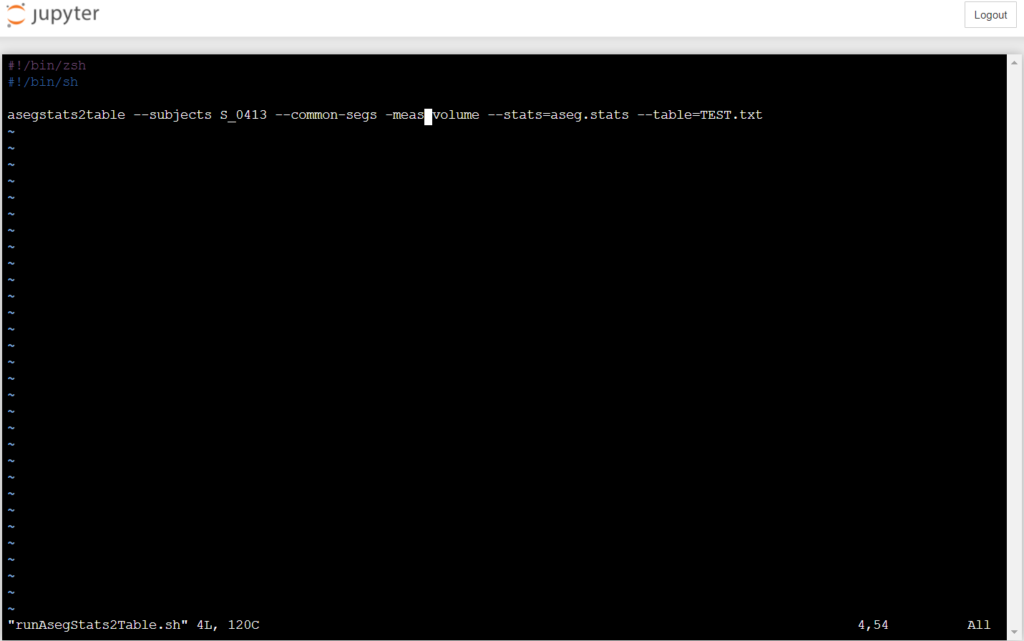
vi runAsegStats2Table.sh#!/bin/sh
asegstats2table --subjects S_0413 --common-segs volume --stats=aseg.stats --table=TEST.txtI am using vi for operating around the new file. You can use “nano” or “vim”. Remember to save the file with “.sh” extension. Why? Because it’s a script.
But, take a step back. If you are not into programming I will write you detailed instructions. How? Why? What for?
- Go to “stats” subfolder
- Open a text editor (command for that action you have above)
- Write a script or just copy and paste code from the box that is under this list
- Save it – keyboard shortcut (in vi editor) – Ctrl + ZZ
- That’s all for now
#!/bin/sh

asegstats2table --subjects <Name of subjects> --common-segs volume --stats=aseg.stats --table=TEST.txt
Take a look deeper look at “asegstats2table” command:
asegstats2table --subjects <Name of subjects> --common-segs <volume,std,mean> --stats=aseg.stats --table=<Name of the output file>- –subjects – the specific name of the object/objects you would like to extract from
- –meas – in this place you have three options – “volume”, “std”, “Area_mm2”, “nvoxels”, “nvertices”, “mean”, “snr”, “max”. “Volume” is a basic choice but you can mess around with the other options.
When everything has gone fine, you would get and output which can be easily opened by any “Excel type” program.
aparcstats2table
The next command gives us the ability to focus on the data from a specific brain cerebral hemisphere. This command is very similar to a previous one but there are a couple of differences.
Steps
- New file with “.sh” extension
- Copy the command
aparcstats2table --subjects <Name of sucject> --hemi rh/lh --meas thickness --parc=aparc --tablefile=<Name of the ouput file>- –hemi – choose between lh and rh (Left-Hemisphere/Right-Hemisphere)
- –meas – there is a lot of options, choose from ‘area’, ‘volume’, ‘thickness’, ‘thicknessstd’, ‘thickness.T1’, ‘meancurv’, ‘gauscurv’
- –parc – choose beetwen:
-‘aparc.DKTatlas’-Desikan-Killinay atlas
-‘aparc.a2009s’-Destrieux atlas - You also can add the other options to the script
Examples:
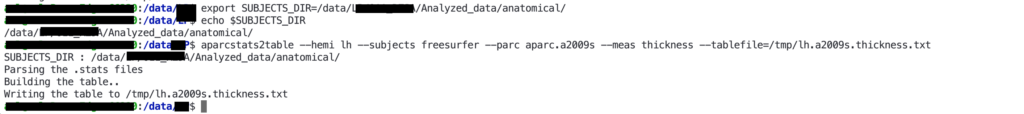
Version for Desikan-Killinay:
export SUBJECTS_DIR=/data/<dataset>/<subject>/Analyzed_data/anatomical/
echo $SUBJECTS_DIR
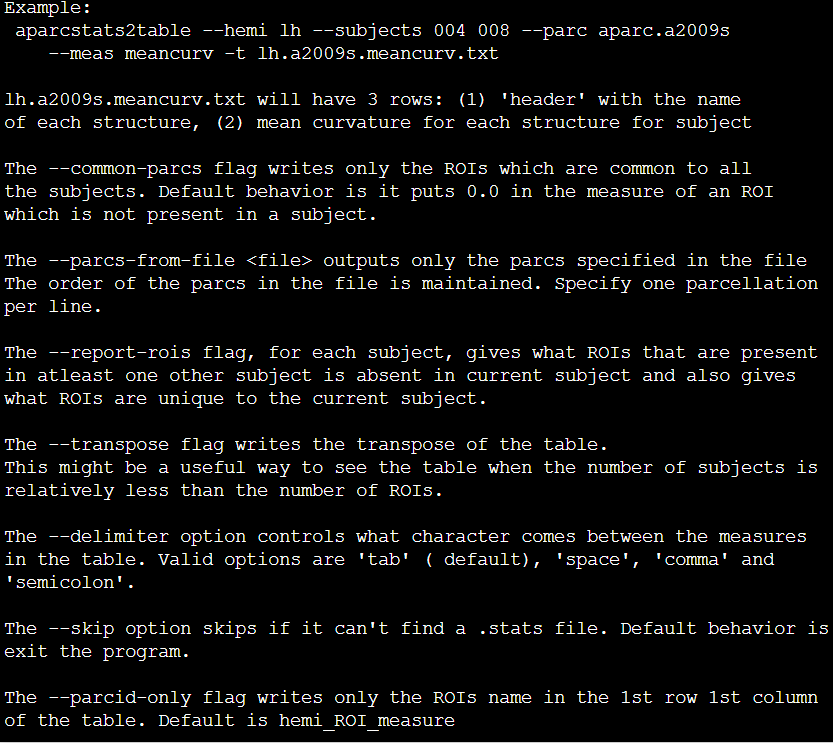
aparcstats2table --hemi lh --subjects freesurfer --parc aparc.DKTatlas --meas thickness --tablefile=/tmp/lh.DKT.thickness.txtFrom man (command’s manual):
TIP! Don’t worry, if you write something wrong, FreeSurfer will inform you about misspelling.
Extras
Links and useful stuff:
- Tremendous and great work about brain analysis by Andy Jahn:
https://andysbrainbook.readthedocs.io/en/latest/ - More about aparcstats2table:
https://rdrr.io/cran/freesurfer/man/aparcstats2table.html - More about atlases and cortical parcellation:
http://132.183.240.105/fswiki/CorticalParcellation - More about FreeSurfer and analysis:
https://fscph.nru.dk/slides/Martin/fs.roi.mr.pdf